About
Hello:) I am Wei
I am a PhD student in the VIXI lab, University of Victoria, under the supervision of Prof. Charles Perin and Miguel Nacenta. My research interest span from visualization co-design, cognitive augmentation, to physicalization, and more generally, interaction design. I was a research intern at Télécom Paris with Prof. Samuel Huron. Before that, I had an incredible MSc (under the instruction of Prof. Ehud Sharlin) at ilab, University of Calgary.
I am a hiker who likes exploring the nature, a designer who has radical ideas, a technician who enjoys fixing machines and software, a gamer who keeps trying despite repeated defeats, and a reader who loves history, sci-fi, fantasy, as well as classics.
You can find my CV here
Publications
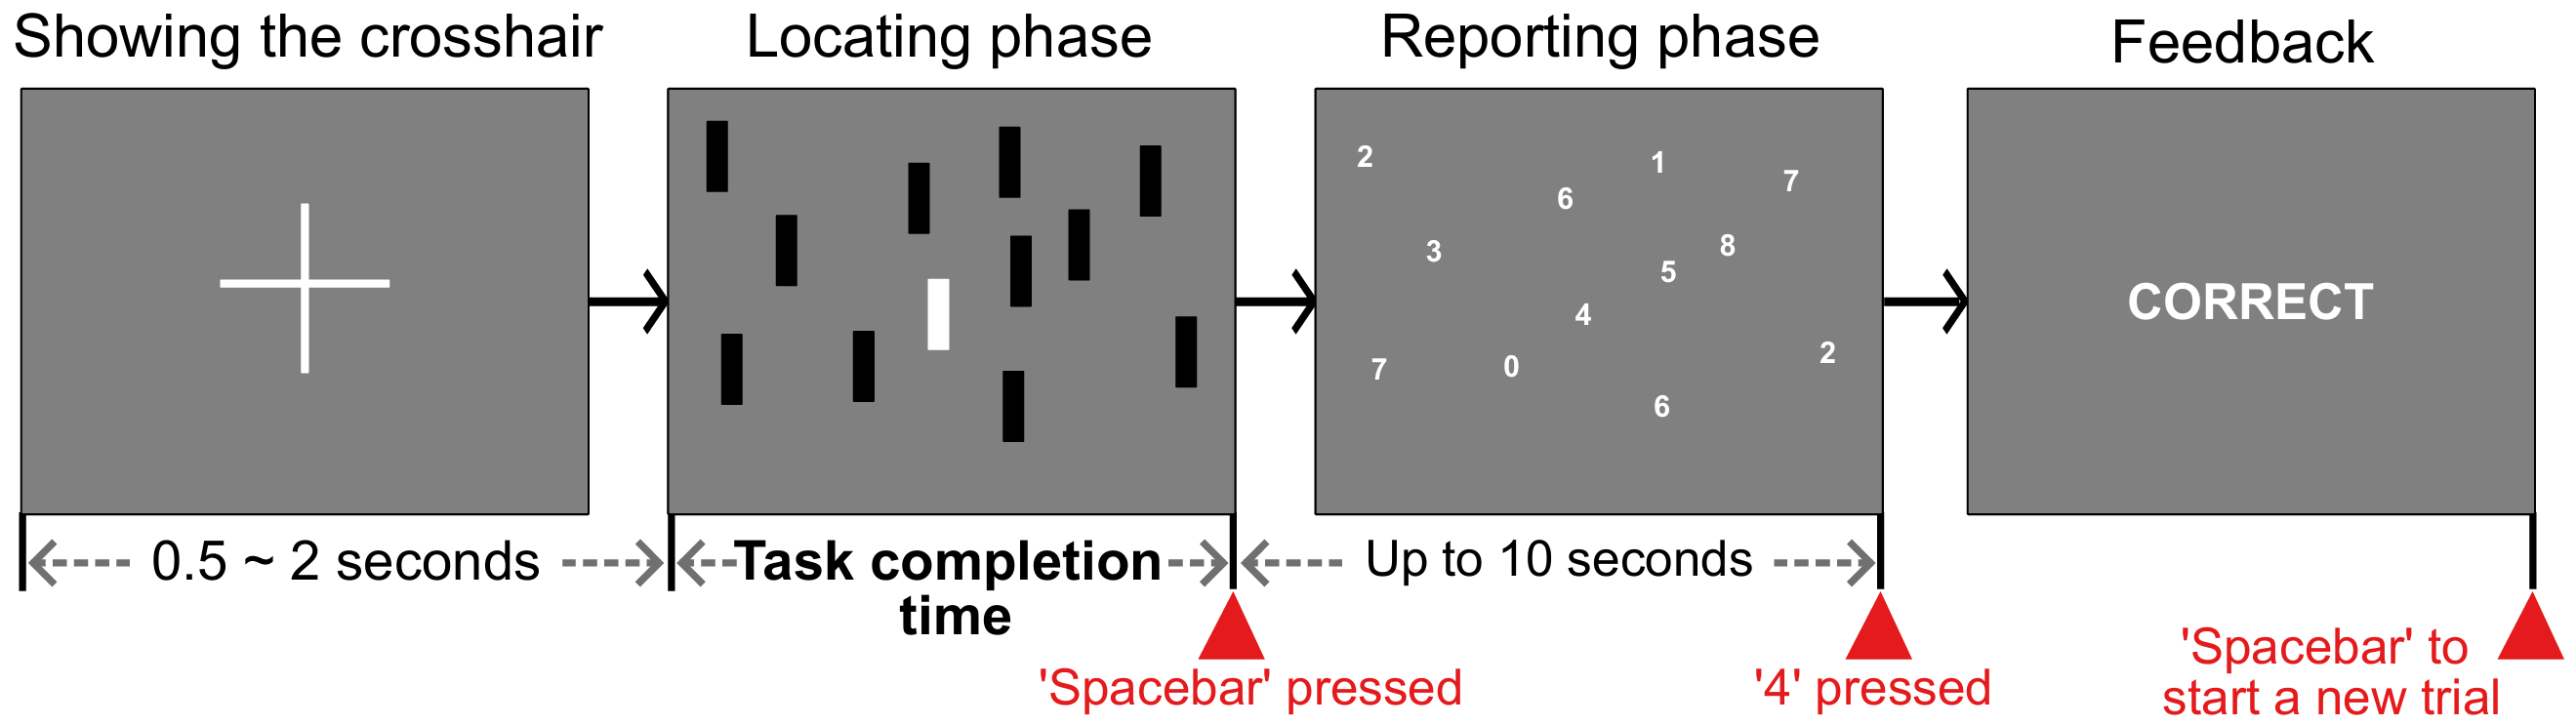
Locatability and Locatability Robustness of Visual Variables in Single Target Localization
Wei Wei, Miguel A. Nacenta, Michelle F. Miranda, and Charles Perin. IEEE TVCG journal paper track at IEEE PacificVis, 2026 Paper
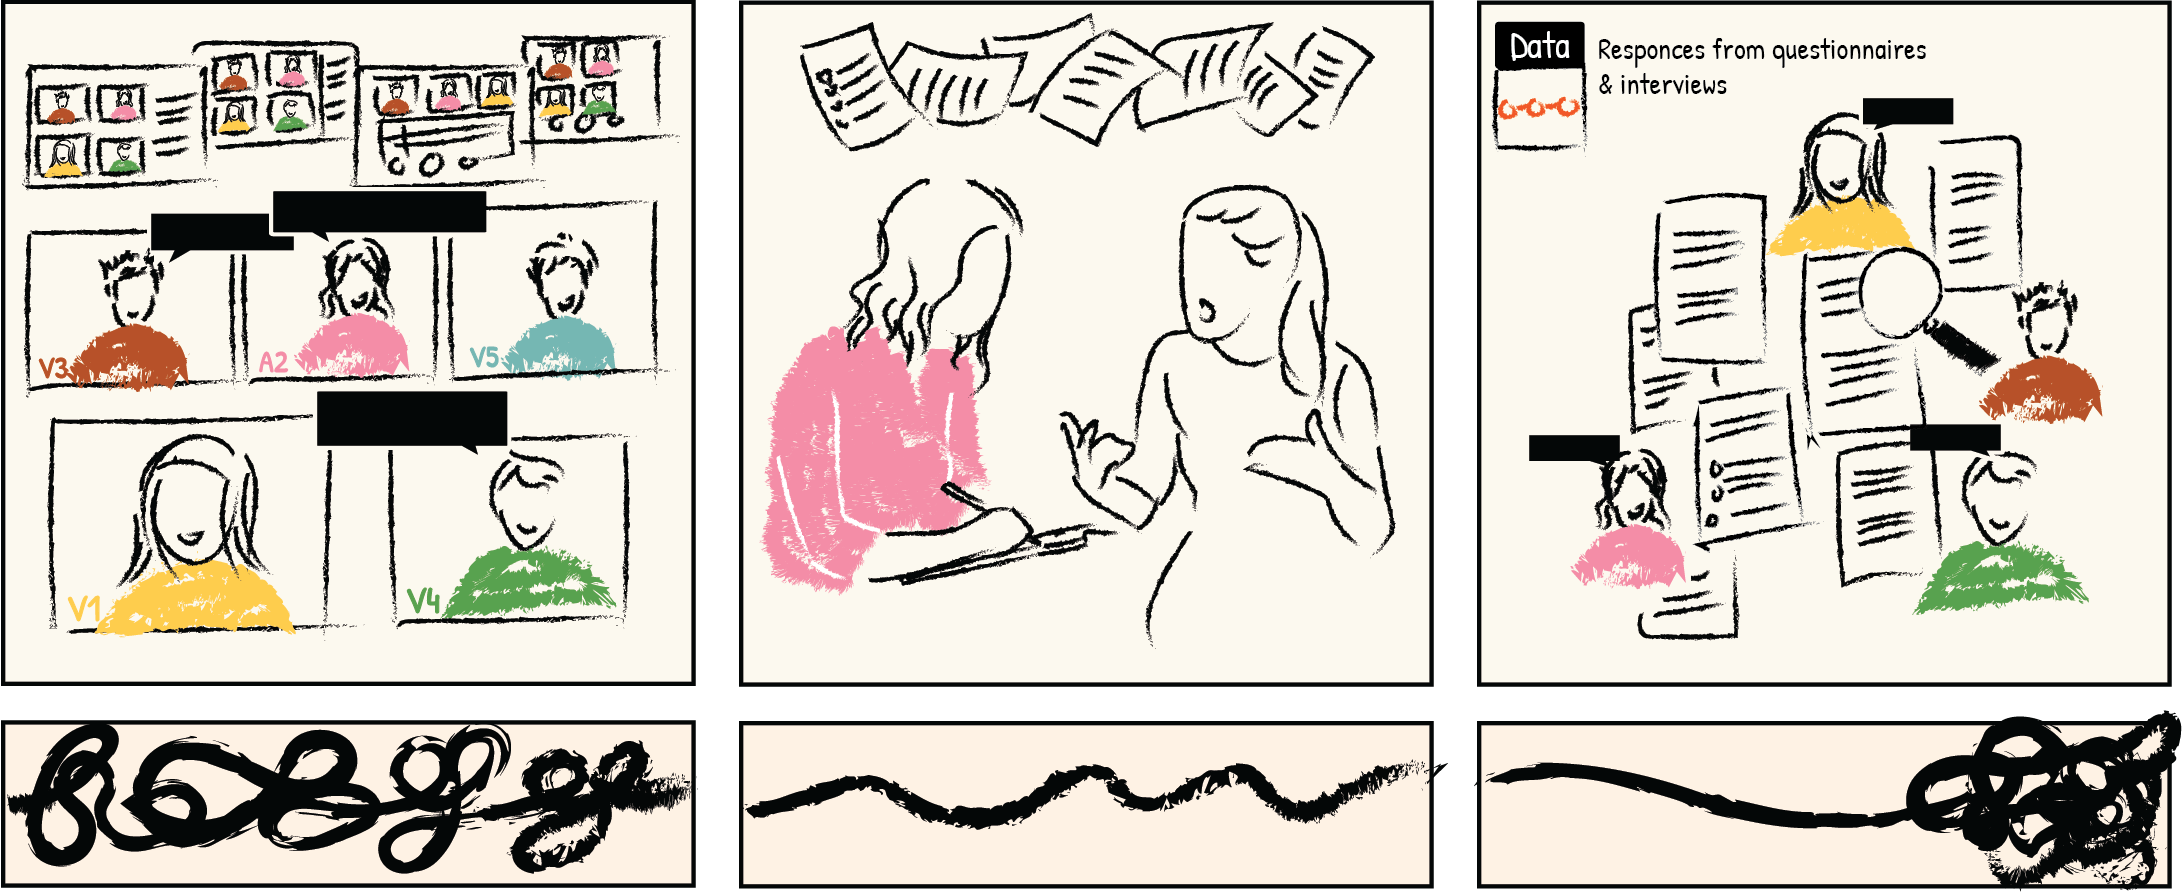
The Fuzzy Front Ends: Reflections on the Never-Ending Story of Visualization Co-Design
Wei Wei, Foroozan Daneshzand, Zezhong Wang, Erica Mattson, Charles Perin, and Sheelagh Carpendale. alt.VIS at IEEE VIS, 2025 Paper
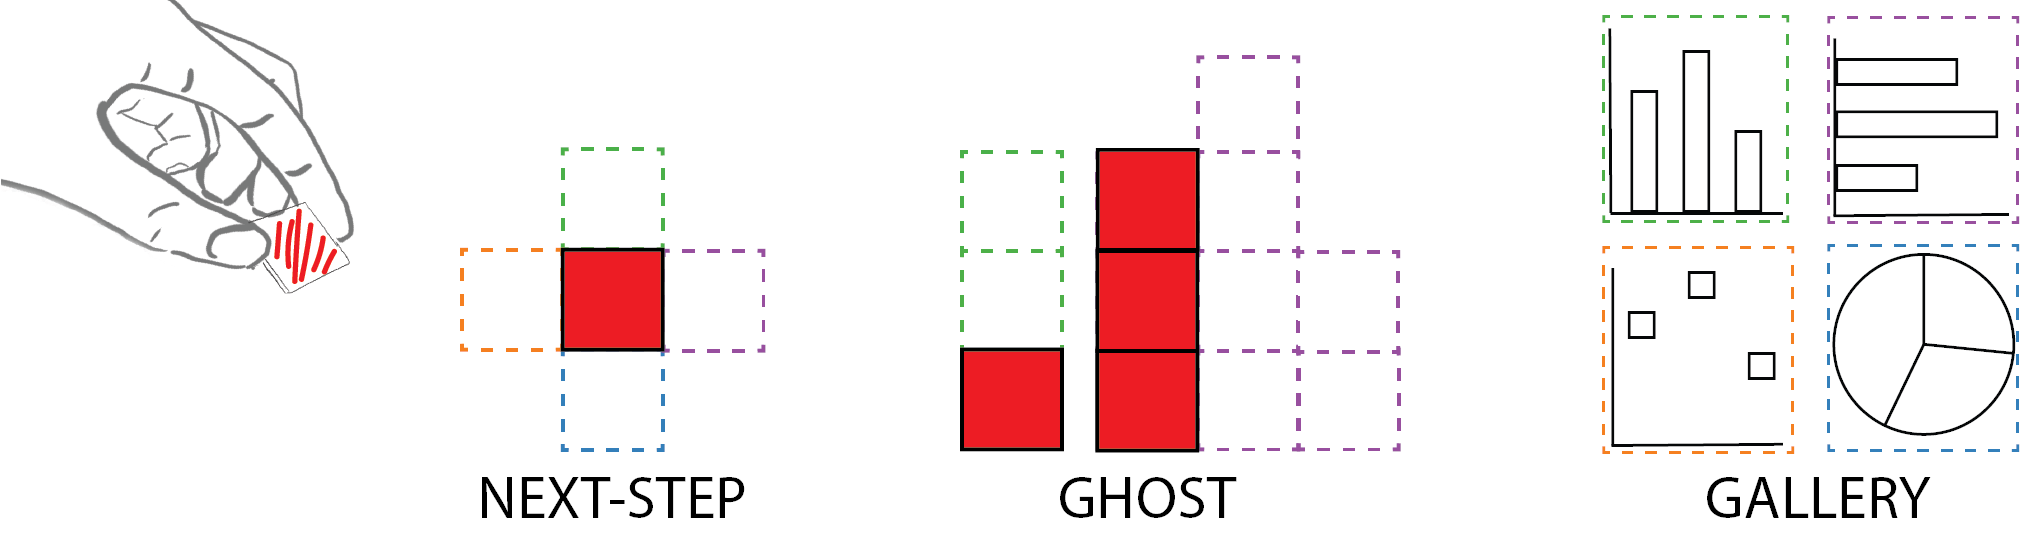
Towards Autocomplete Strategies for Visualization Construction
Wei Wei, Samuel Huron, and Yvonne Jansen. IEEE VIS, 2023 Paper
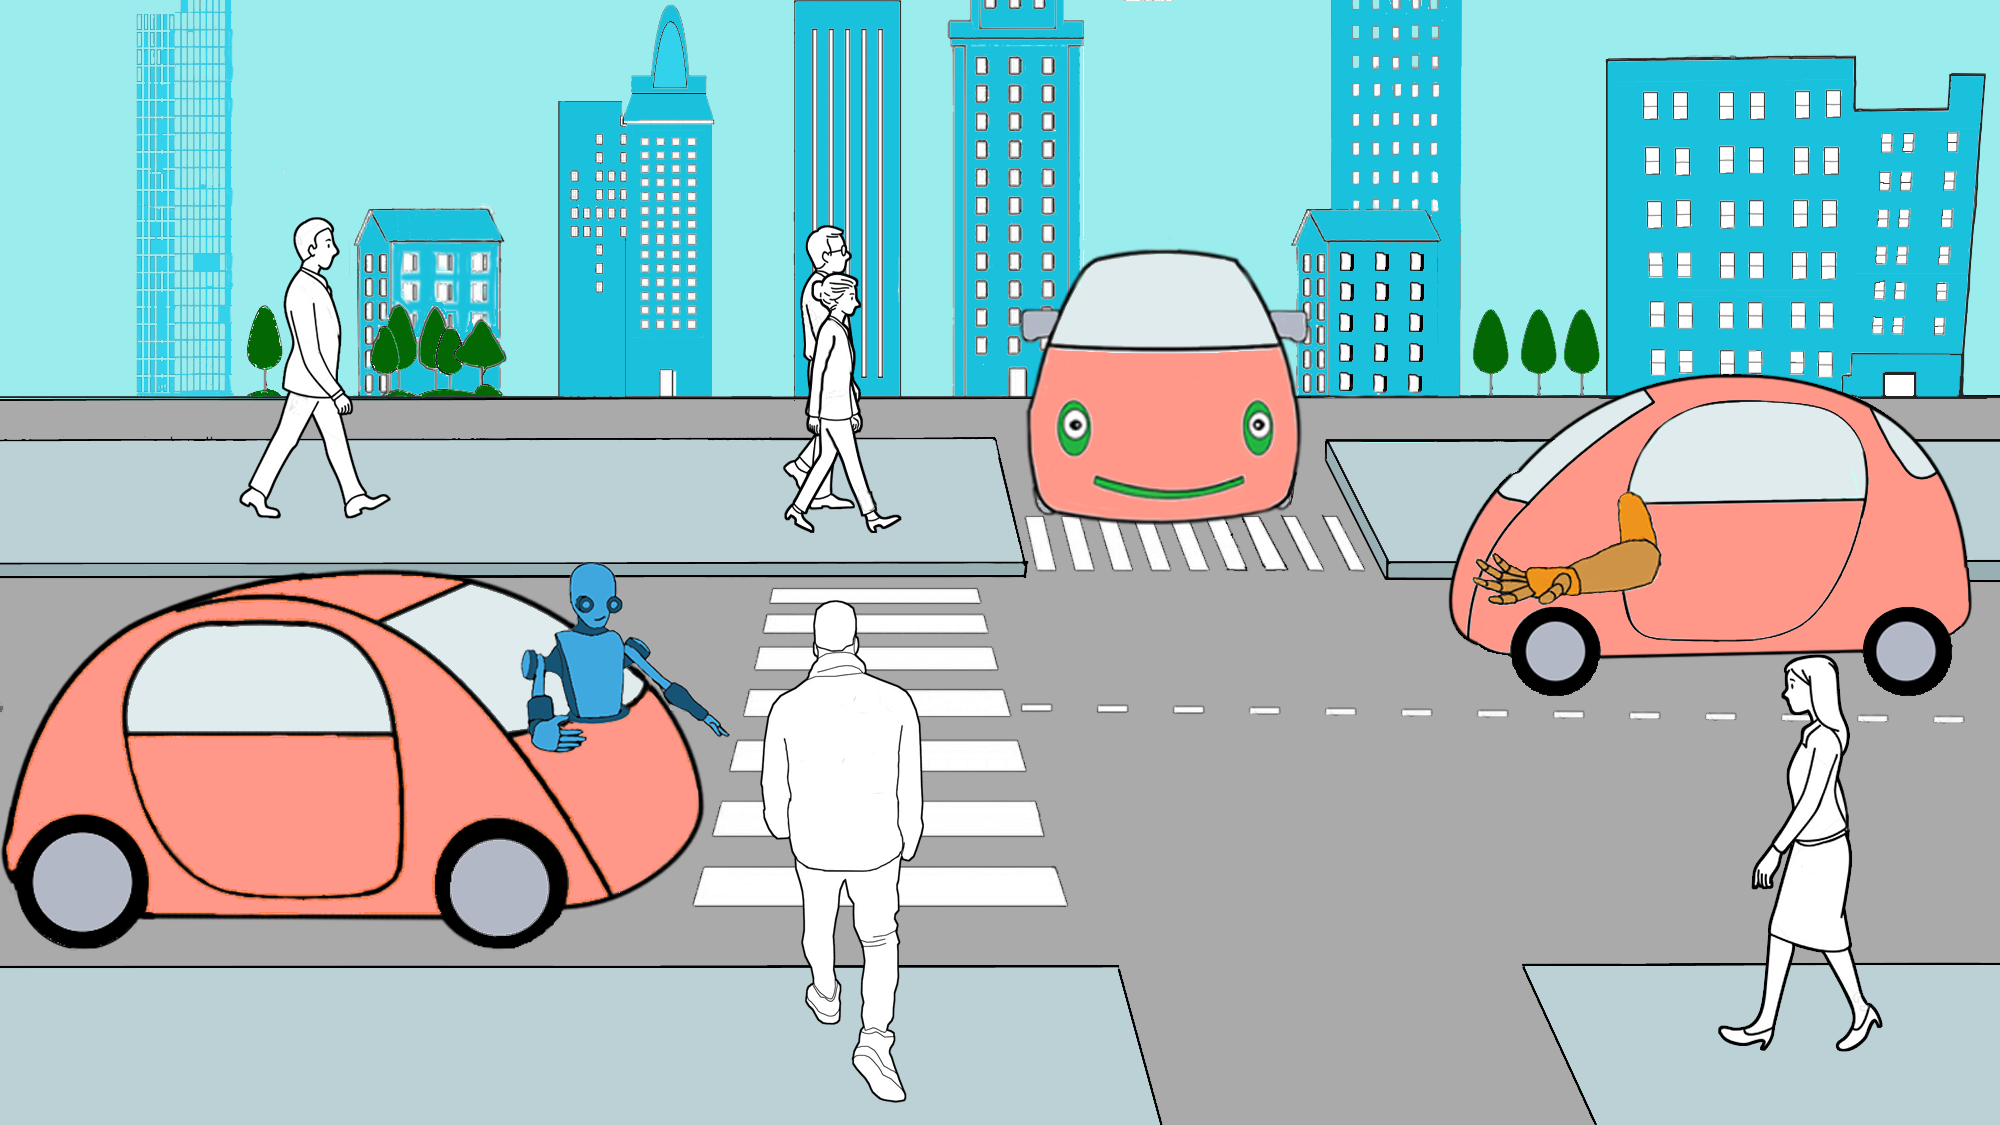
Design of Anthropomorphic Interfaces for Autonomous Vehicle-Pedestrian Interaction
Wei Wei. Master Thesis, 2022 Paper
Touch and Beyond: Comparing Physical and Virtual Reality Visualizations
Danyluk Kurtis, Teoman Tomo Ulusoy, Wei Wei, and Wesley Willett. IEEE Transactions on Visualization and Computer Graphics, 2020 Paper
Ongoing Projects
Co-design Visualization with the Arts Sector on Vancouver Island
This project is a long-term collaboration with the local arts communities on Vancouver Island, supervised by Prof. Sheelagh Carpendale at SFU and Charles Perin at University of Victoria. The collaboration took shape through a participatory initiative that brought together members of the arts sector and visualization researchers, with the shared goal of empowering local arts communities through data science and visualization. The project aimed to explore economic data relevant to the arts sector uncover narratives embedded in existing datasets, and co-design potential solutions for improved data collection and visualization. Ultimately, the goal is to equip the local arts community with tools and insights to support data informed decision-making and policy change on arts funding allocation
The Heroes, Villains and Beyond - Surface hidden stories from the Records of the Three Kingdoms
As a hobby-oriented project, I am collecting and maintaining a data sheet that aims to log all individuals recorded in Sanguozhi - Records of the Three Kingdoms, a Chinese history classic that chronicles China’s history from 180 CE to 284 CE. You can find more info about the book on the Wiki Page. At this moment, the data sheet has more than 2500 entries. A detailed description of the dataset is here. In the future, I will turn it into a open-source project and create a database for it. The goal of the project is to develop an online tool that utilizes the potential of employing visualization approaches (
timeline,network,map, and more) to synthesize and extract insights from this ancient history book,